| > | myplot:=proc(x,f,x0,xmin,xmax,N)
local y; y:=convert(taylor(f(x),x=x0,N+1),polynom); plot([y,f(x)],x=xmin..xmax,color=[red,blue],caption=typeset("Degree of Taylor polynomial ",N)); end proc; |
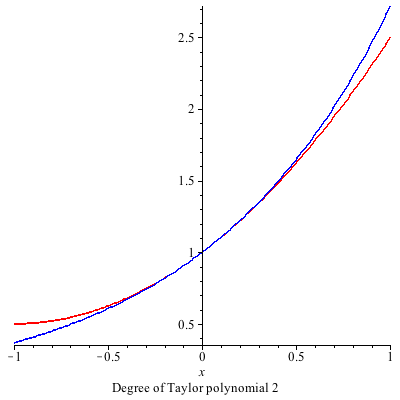
| > | myplot(x,exp,0,-1,1,2); |
 |
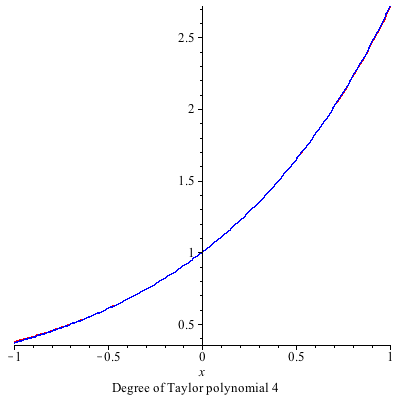
| > | myplot(x,exp,0,-1,1,4); |
 |
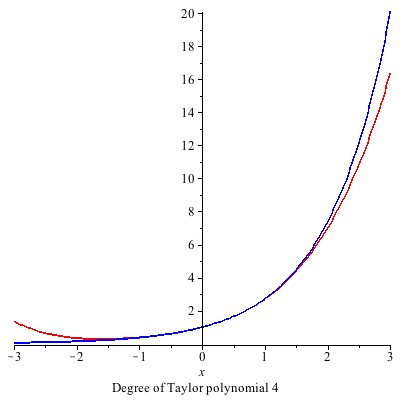
| > | myplot(x,exp,0,-3,3,4); |
 |
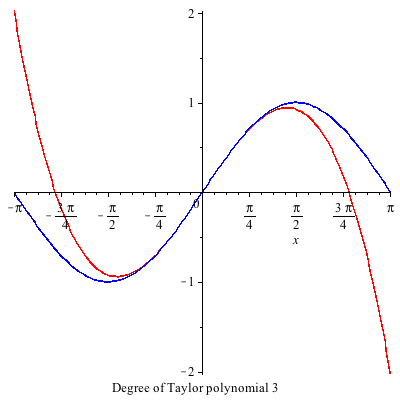
| > | myplot(x,sin,0,-Pi,Pi,3); |
 |
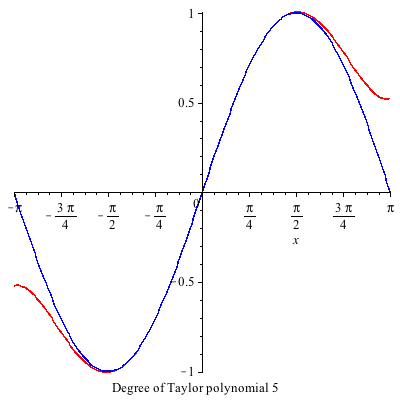
| > | myplot(x,sin,0,-Pi,Pi,5); |
 |
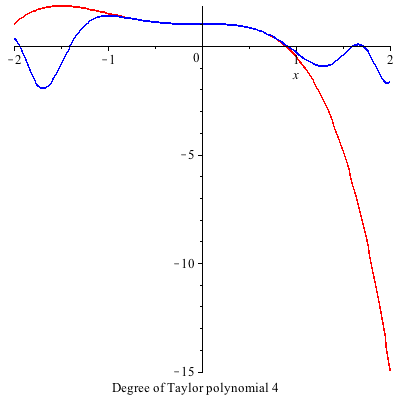
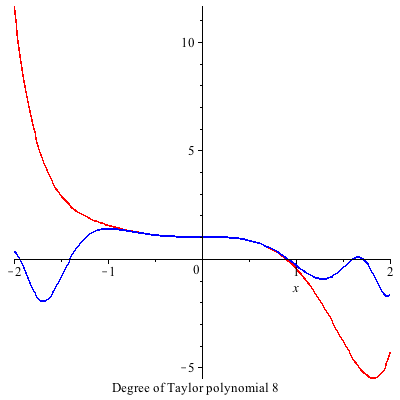
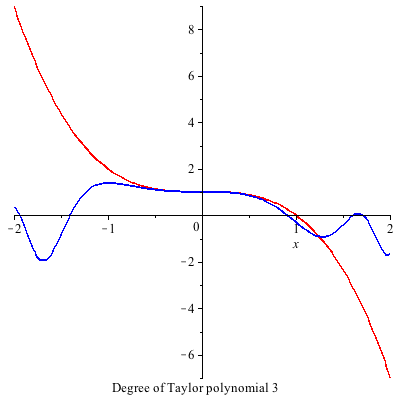
| > | g:=x->cos(x^2)-sin(x^3); |
| > | myplot(x,g,0,-2,2,4); |
 |
| > | myplot(x,g,0,-2,2,8); |
 |
| > | myplot(x,g,0,-2,2,3); |
 |
| > | with(plots): |
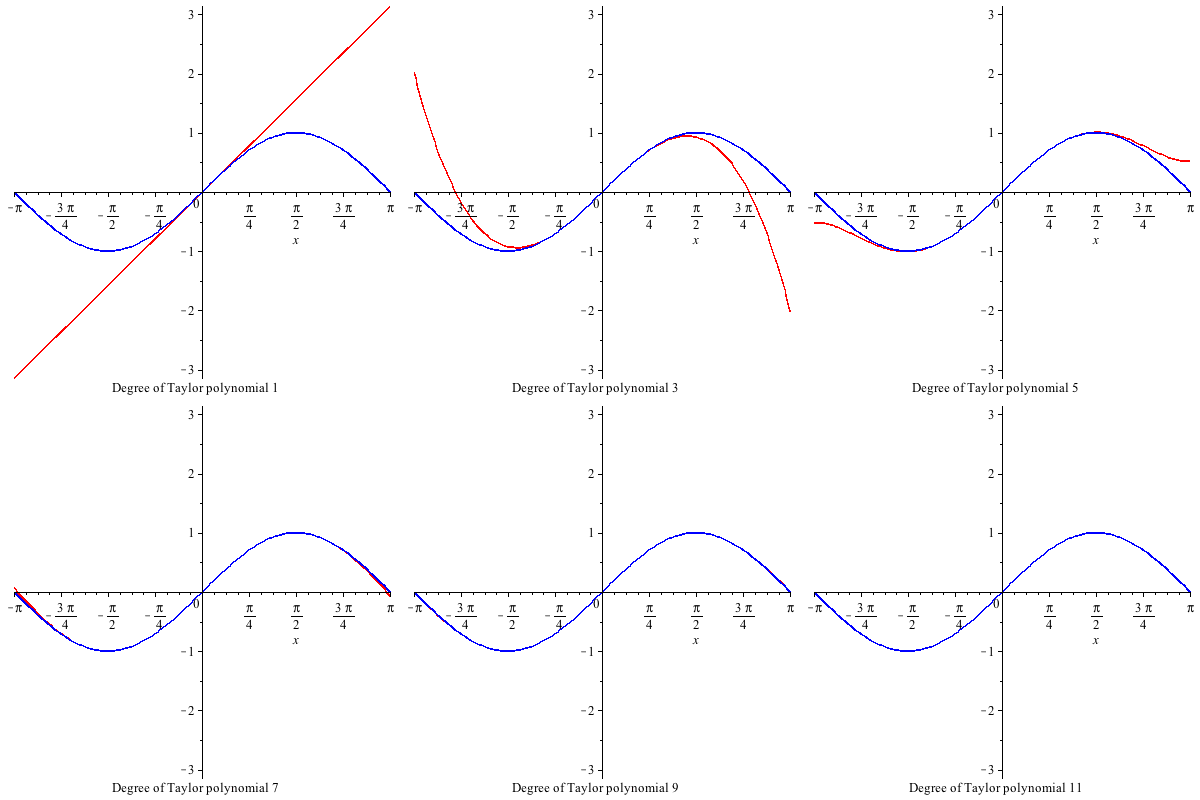
| > | L:=[seq(myplot(x,sin,0,-Pi,Pi,2*k+1),k=0..5)]: |
| > | display(L,insequence=true); |
 |
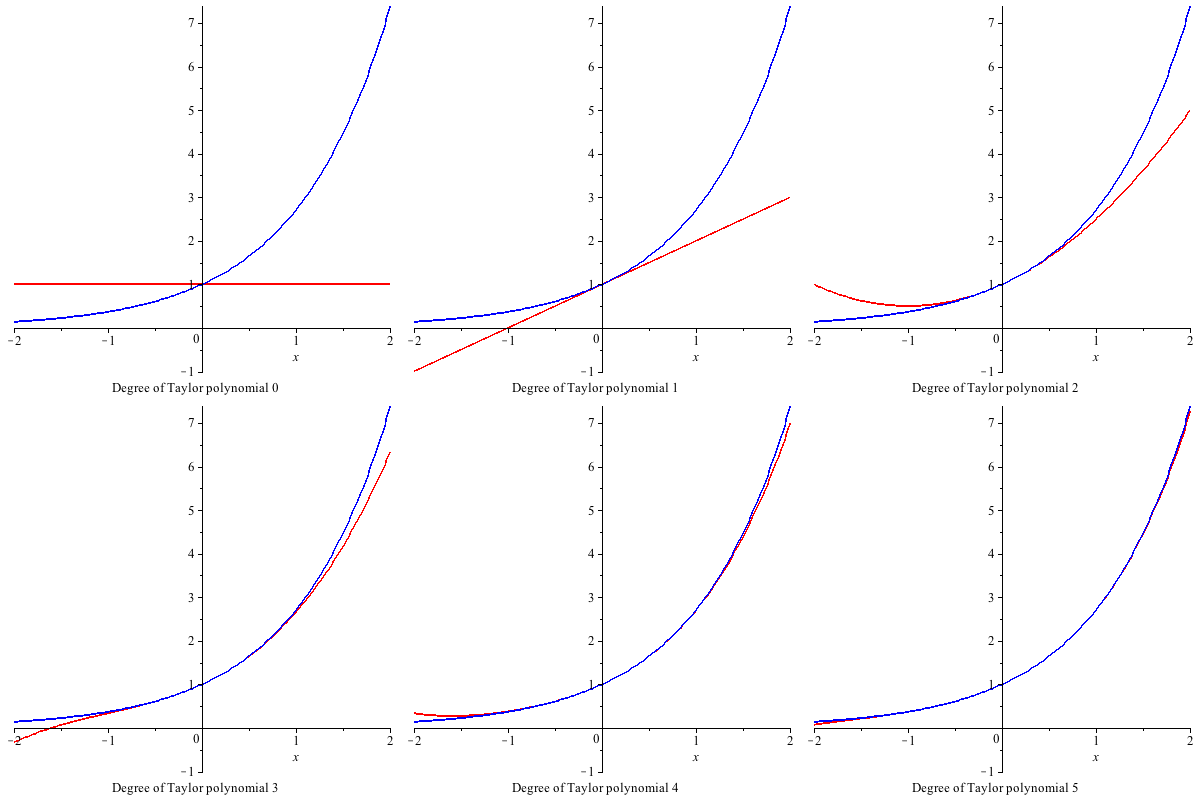
| > | L1:=[seq(myplot(x,exp,0,-2,2,k),k=0..5)]: |
| > | display(L1,insequence=true); |
 |
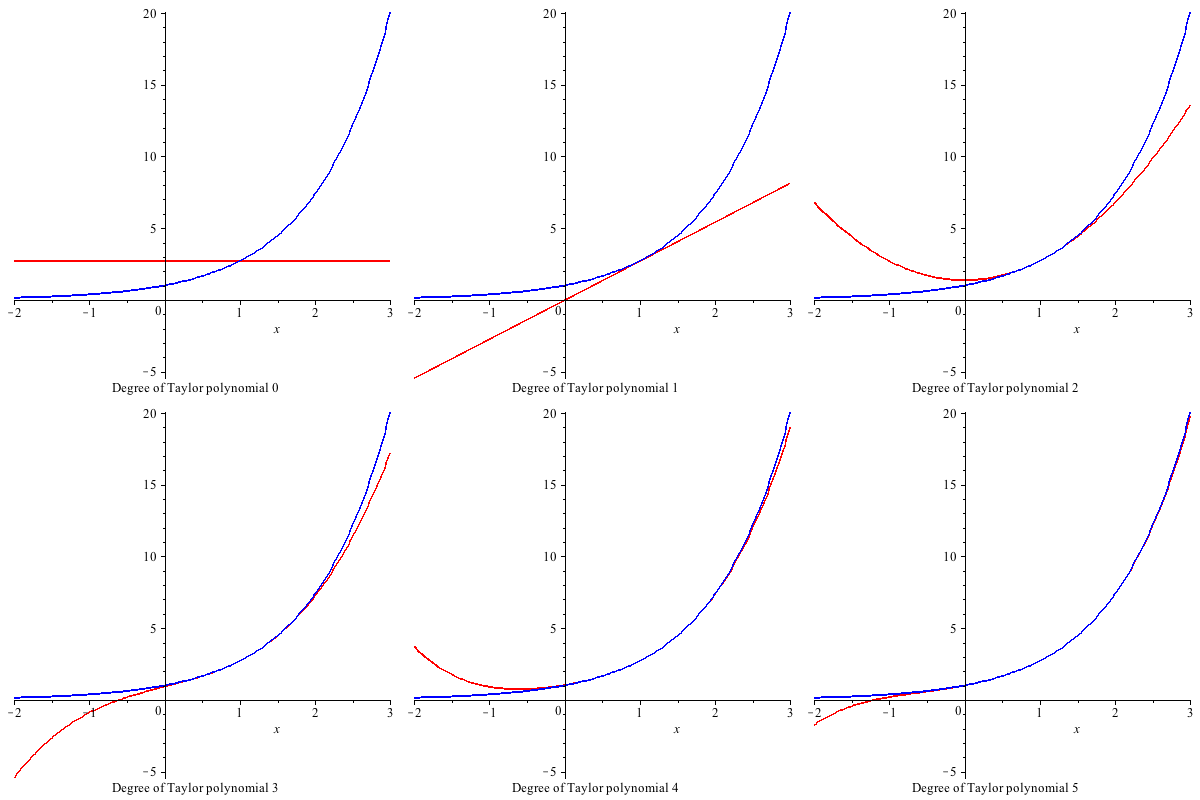
| > | L1:=[seq(myplot(x,exp,1,-2,3,k),k=0..5)]: |
| > | display(L1,insequence=true); |
 |
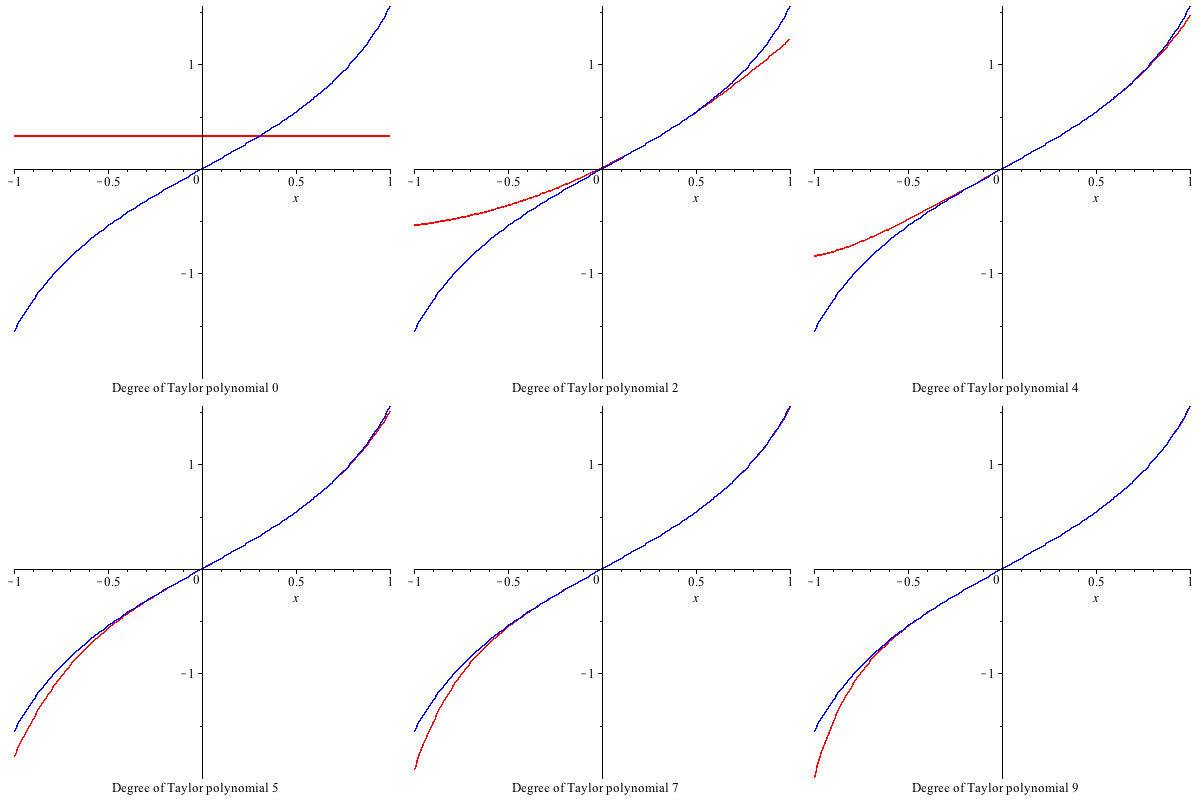
| > | L1:=[seq(myplot(x,tan,0.3,-1,1,k),k=0..9)]: |
| > | plots:-display(L1,insequence=true); |
 |
| > |
| > |