DNA Mixture Separator in R
The online DNA mixture separating tool at
http://people.math.aau.dk/~tvede/dna/mixsep.php
has not been maintained for quite some time. The implementation is
written entirely in php - a not very efficient language for performing
statistical analysis. Hence, I have implemented the code in R
(www.r-project.org) together with an easy to use
graphical user interface (GUI). The algorithm and GUI is available for
both Windows and Linux below. The package is also available on CRAN:
mixsep on CRAN.
[ Download |
Usage |
Installation : CRAN/Manual |
Guides | Screen shots ]
News
The mixsep-package was presented as a poster at the International Society of
Forensic Genetics 24th Congress in Vienna, August 29 - September 3
2011. Click here to download the poster: ISFG2011 Poster.
Download
CRAN: mixsep 0.2
Windows: mixsep_0.2.zip
Linux: mixsep_0.2.tar.gz
Usage
Once the mixsep-package is installed (see below) it is invoked in R by
the following command:
library(mixsep)
mixsep()
The screen shots below explains the various steps
for analysing a DNA mixture using the GUI. A more detailed description
of the underlying model and algorithm is available as "ahead of
print"-paper in the Journal of Computational Biology (Identifying
contributors of DNA mixtures by means of quantitative information of
STR typing). Furthermore, I have a manuscript in preparation
explaining in more "how to"-terms to use the mixture separating tool
(GUI) in R. More detailed guides and screen shots are available below.
Installation
See the install guides for CRAN and
manual install tips.
Guides
The following guides show how to use the different features of the GUI:
- Install R and the mixsep-package (Windows only): Install
- Creating a shortcut on the desktop (Windows only): Shortcut
- Setup the connection to a database and extract case information: Database (Connection file)
- Load data from files (with a single case and multiple cases): Files
- Analyse a case file (wang.csv) and
determine the best matching configuration: Best match
- Analyse a case file (wang.csv) with
a known (suspect) profile: Known profile
Note that the version number in the screen shots used in the
guides differ from the current release. However, the layout and
content is the same. Only screen shots with updated content and layout
is updated with new releases.
Screen shots
The screen shorts below show some of the different tabs of the main window
and plots for diagnostics. Please refer to the guides for
further details and more screen shots.
 |
 |
 |
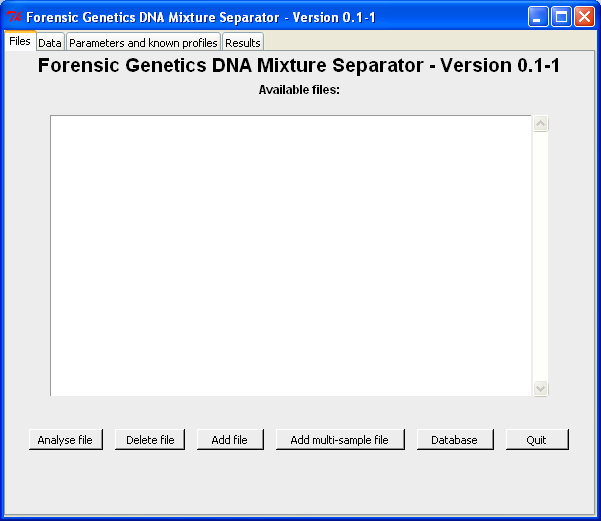
| Loading files and selecting case for analysis. |
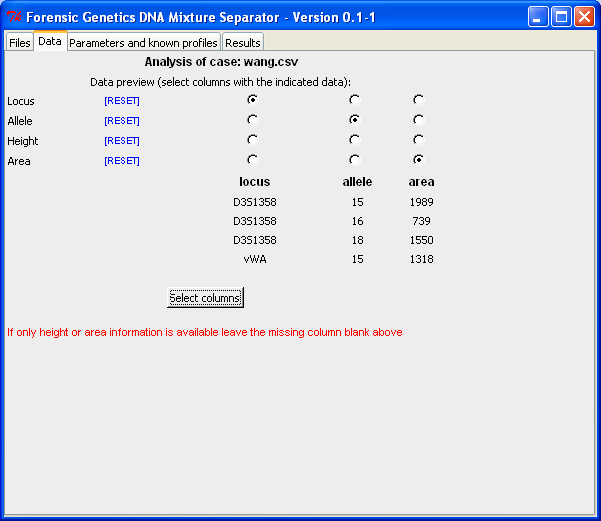
Select columns in the file containing the relevant data. |
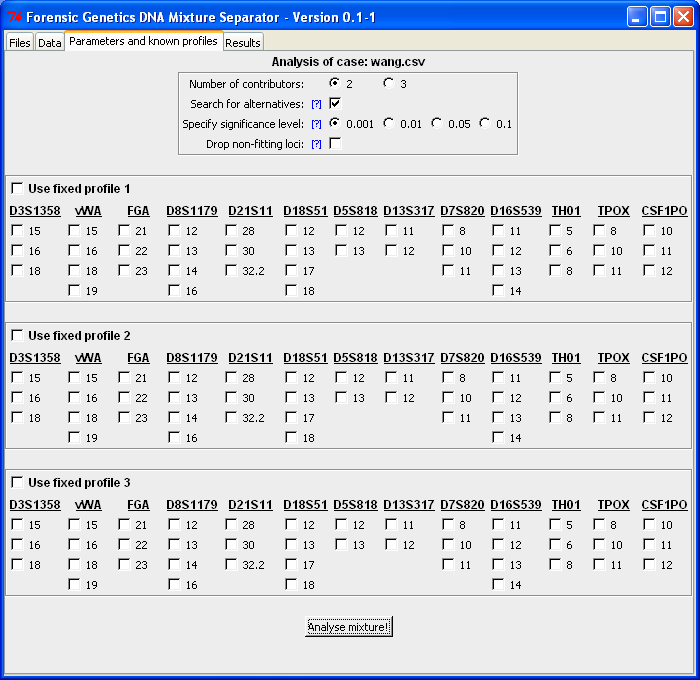
Set analysis parameters: Number of contributors,
whether possible alternatives should be listed etc., and specification of known profiles. |
 |
 |
 |
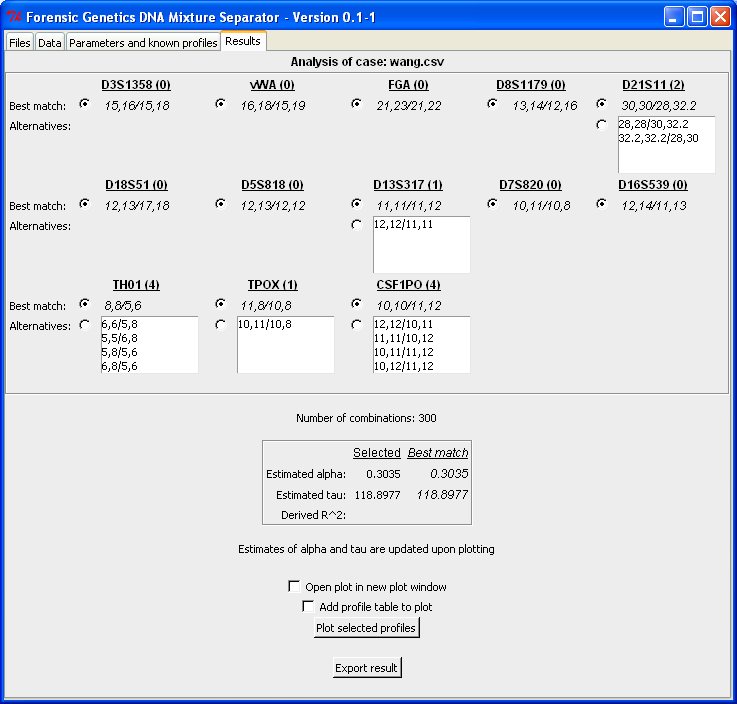
Resulting sets of plausible profiles. |
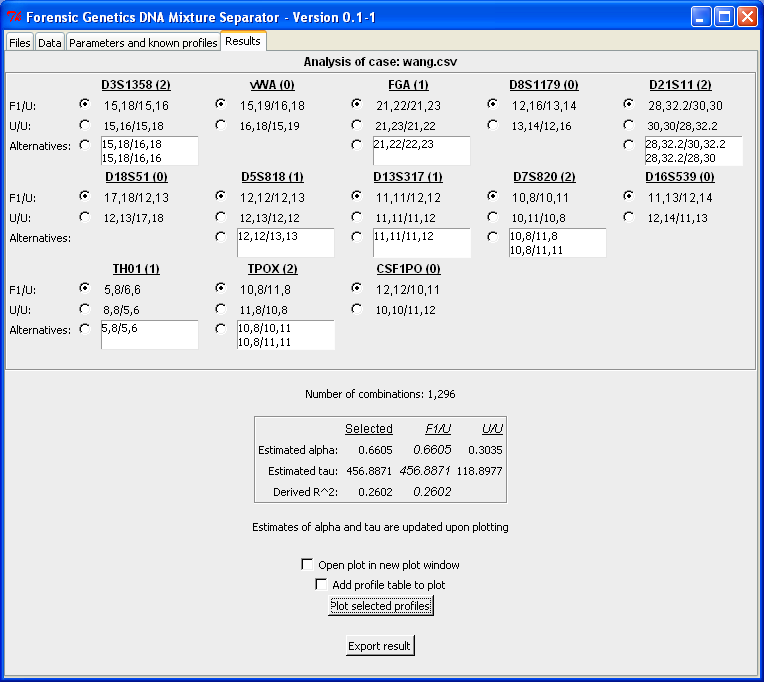
Resulting sets with a fixed/known profile specified. |
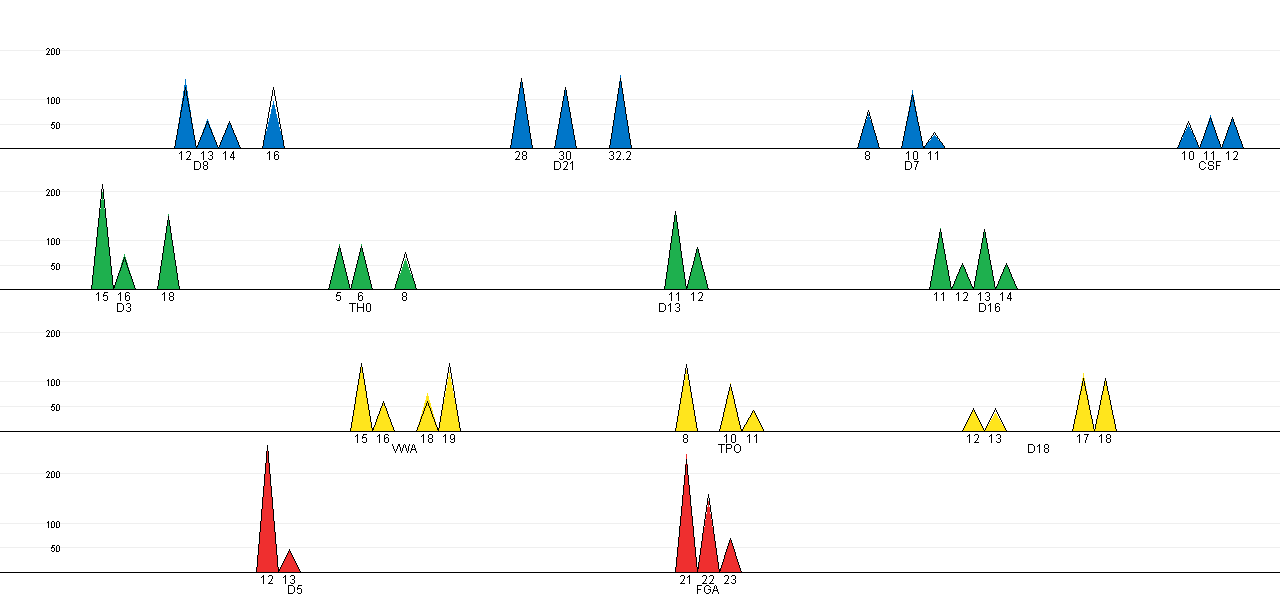
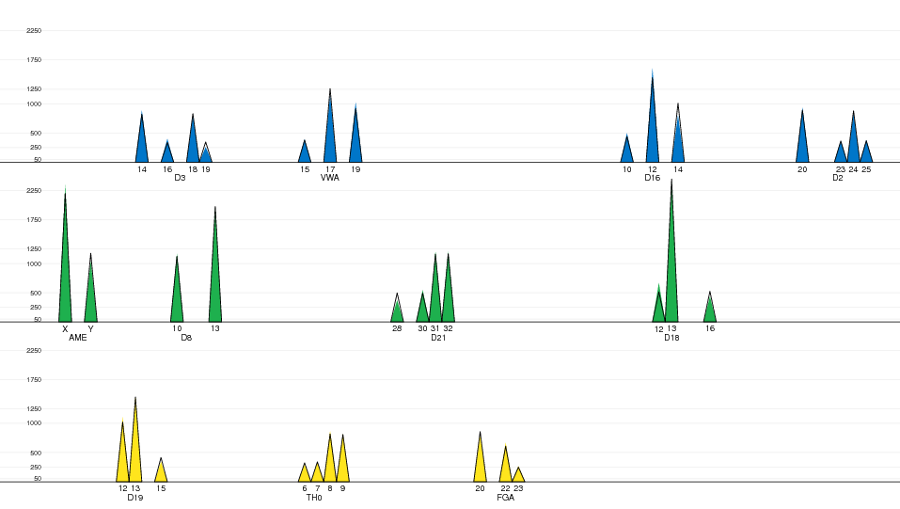
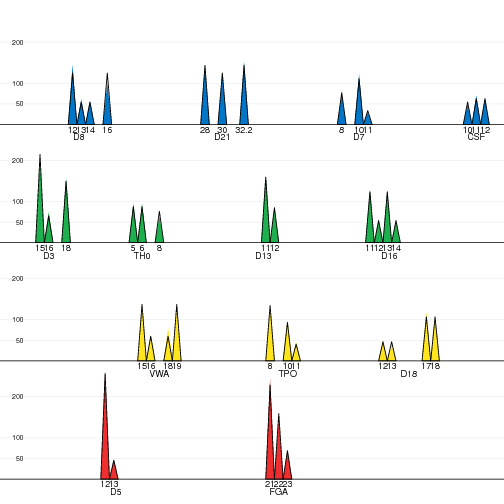
Plot of the observed and expected peaks intensities. |